On this page
The short version
An AI visibility report clients can trust has nine parts. Each one below comes with a real example, filled in from a Vancouver electrician's live numbers.
- The headline: a rate with a range
- By AI system
- Change since last period, on the same questions
- Questions won and lost
- Who AI named instead
- What AI read: cited vs named
- Google next to AI
- Next month's actions
- A short method note
Plus how to explain the ups and downs, what to leave out and the template in one table.
Why AI visibility reports go wrong
The short answer: they report single answers as if they were rankings, and AI answers change every day.
I've seen agency decks with one ChatGPT screenshot: "you're recommended!" Next month the screenshot shows a competitor, and the client asks what went wrong. Usually nothing did. The same check, run four times in one day, scored 13, 25, 18 and 20 in our data. Five AI systems asked the same question on the same morning agreed only about 1 time in 5, as we showed in 5 AIs, same questions, 1,814 answers.
So an honest AI visibility report does three things differently:
- It reports rates, not snapshots. How often the business was named, out of how many answers.
- It shows a range. A small sample means a wide range, and the client should see that.
- It only compares like with like. Same questions, same AI systems, back-to-back periods.
SparkToro's research reached the same conclusion from a different angle: AI recommendations are too inconsistent to report from a handful of runs.
The real example
Everything below uses Kato Electrical, a Vancouver-area electrician whose account is our public demo. The report covers two back-to-back periods on the same 16 buying questions:
- 24 September to 3 October: 772 answers
- the 12 days from 4 October: 942 answers
Each period combines ChatGPT, Gemini, Google AI Mode, Google AI Overviews and Perplexity, checked once a day, logged out, from his city. That's a real report's worth of data, not a demo dataset. I sell the tool that collected it, so weigh that. You can check every number in the demo.
The headline: a rate with a range
What to include: the share of AI answers that named the business, how many answers that's based on, and the range around it.
Kato's headline:
Named in 16.6% of AI answers (156 of 942), give or take 2.4 points. Last period: 16.3% (126 of 772), give or take 2.6. No real change.
The "give or take" is a standard 95% range for a proportion. When two periods' ranges overlap, as they do here, say so plainly: the number didn't really move. Clients take that far better than an unexplained dip.
If you also use a single score, show it next to the rate, not instead of it. Kato's score in our tool (70% weight on being named, 30% on being cited) was 14.3, against 15.2 the period before. It's the same story: low, and flat.
By AI system
What to include: the same rate for each AI system, because they behave very differently.
| AI system | 24 Sep–3 Oct | From 4 Oct |
|---|---|---|
| Google AI Mode | 22.6% (36/159) | 22.9% (44/192) |
| Perplexity | 21.9% (35/160) | 21.4% (41/192) |
| ChatGPT | 14.4% (23/160) | 14.1% (27/192) |
| Gemini | 8.1% (13/160) | 13.0% (25/192) |
| AI Overviews | 14.3% (19/133) | 10.9% (19/174) |
How I'd write it up for Kato: "Google AI Mode and Perplexity name you in about 1 answer in 5. ChatGPT and Gemini in about 1 in 7 or 8. Gemini looks up, from 8% to 13%, but with about 160 answers per period that's still inside the normal range, so we'll watch it rather than claim it."
Always note AI Overviews' missing days. Google showed no AI Overview on 27 checks in the first period and 18 in the second. Those aren't zeros, and they shouldn't drag the rate down. We explain why in AI Overview tracking for near me searches.
Change on the same questions
What to include: the change since last period, only on the same question set, in percentage points, with a note on whether it's bigger than the range.
For Kato: named rate +0.3 points (16.3% → 16.6%), within the range. Cited rate (answers linking to his own site) 12.7% → 8.9%. That fall is mostly Perplexity, which linked to his site in 43% of its answers in the first period and 33% in the second.
One rule I never break: if the questions changed, the numbers aren't comparable. Kato's question set grew from 10 to 16 in late September, which is why this example starts on 24 September. A report that compares a 10-question month with a 16-question month is comparing different things.
Questions won and lost
What to include: the questions that moved most, the ones you lead, and the ones where the business is invisible.
For Kato:
- Leading: "best licensed electrician in Vancouver" (56%), "best electrician in Burnaby" (62%, up from 52%) and "best electrician in Vancouver" (57%, up from 46%).
- Slipping: EV charger installation, from 27% to 19%.
- Invisible: six questions didn't name him once in the second period, mostly Coquitlam, Surrey and Squamish.
The honest caveat: each question has only about 50 to 60 answers per period, so the range on each is roughly ±13 to ±15 points. Burnaby's rise is encouraging, not proven. Say "up, worth watching", not "we improved Burnaby by 10 points".
Who AI named instead
What to include: the competitors named most often, so the client knows who they're really up against in AI answers.
For Kato, across both periods, the businesses named most often were:
- Intel Power Electric: at least 87 answers
- Expert Electric: 74
- TDR Electric: at least 74
- Whitley Electric: 62
- Fusion Point Electric: at least 57
Some names appear under two spellings ("Ltd." and without), so I report the larger count and say "at least".
The surprise for Kato: he was named in 282 answers himself, more than any single competitor. He's the most-named electrician in these answers overall. He's just absent from whole areas, which is where Intel Power and Fusion Point win.
Show this section with care. Clients often react to a competitor's name more than to their own numbers. Keep it factual: who AI named, how often, and on which questions.
What AI read
What to include: how often AI cited the client's website, and whether those citations came with the client's name.
A citation isn't a recommendation. In our study of 1,082 answers that cited a business's own site, 57% didn't name the business. See when your own web page helps a competitor win.
For Kato, AI cited his site in 12.7% of answers in the first period and 8.9% in the second. Perplexity was the biggest reader. Report "cited" and "named" side by side, and flag any page that's read often without the name.
Google next to AI
What to include: the client's Google position for the same questions, next to the AI rate, because they don't move together.
For Kato, his site was in Google's top 10 on any day for only 4 of the 16 questions. Yet AI named him most on "best electrician in Burnaby", where he never reached Google's top 10. That's exactly the gap we found across five businesses in Invisible on Google, recommended by AI.
Putting the two side by side stops a common client misunderstanding: "we rank, so we must be in ChatGPT", or the reverse.
Next month's actions
What to include: three to five specific actions, each tied to a number in the report, with the number you'll check next month.
Kato's actions, straight from his data:
- Coquitlam: zero on three questions while Intel Power and Fusion Point lead. Get onto the Coquitlam pages of the directories and list sites AI reads there, and strengthen his Coquitlam page. Check: Coquitlam named rate.
- EV chargers: slipping from 27% to 19% while TDR Electric leads. Refresh the EV charger page and its listings. Check: EV question named rate.
- Long spoken questions (Surrey, Port Coquitlam, Squamish): zero in the second period. Put hours, same-day service and areas covered in plain words. Check: those questions.
- Perplexity citations: down from 43% to 33% of its answers. Check his pages are still reachable and current.
- Burnaby and Vancouver: protect what's working. Keep listings and reviews current.
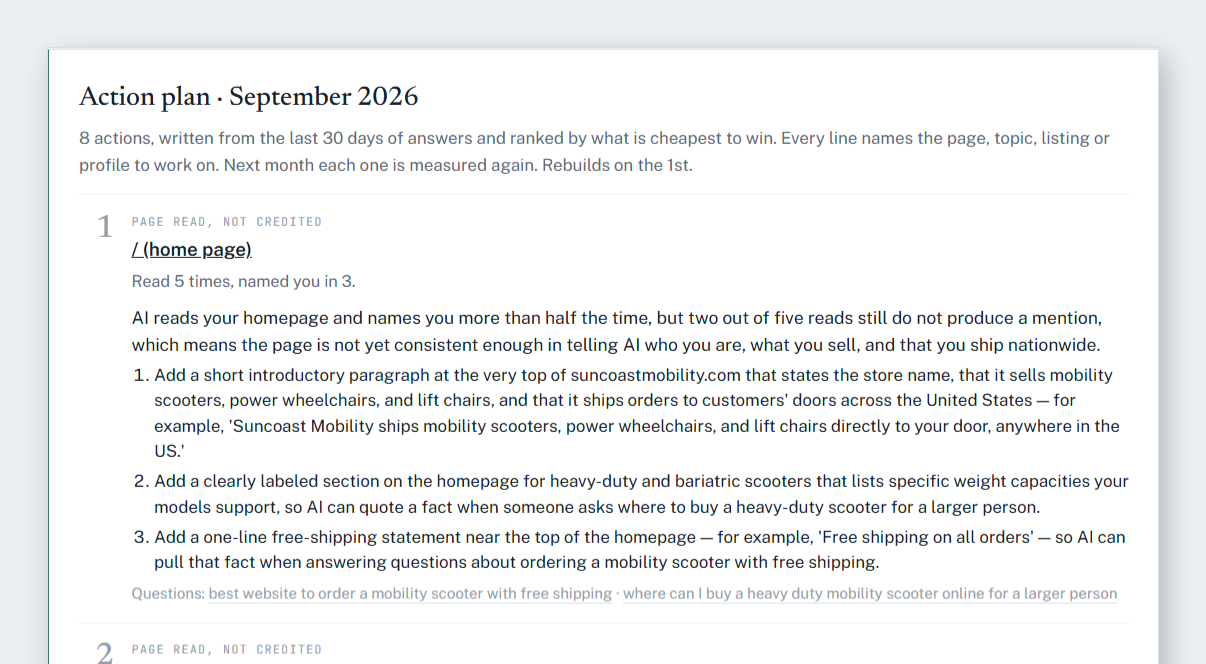
Tie every action to a number. Next month, the report opens with "here's what we did, and here's what moved", which is the part clients actually read.
More on choosing actions: how to get recommended by ChatGPT and which websites ChatGPT trusts.
The method note
What to include: two or three lines at the end, saying how the numbers were collected. For Kato's report:
Measured daily from 24 September in ChatGPT, Gemini, Google AI Mode, Google AI Overviews and Perplexity, logged out, from Vancouver. Same 16 questions throughout. Ranges are 95%. Days with no AI Overview are excluded, not counted as zero. Failed checks are excluded.
It takes thirty seconds to read and answers most "but how do you know?" questions before they're asked. Our full method is on the how it works page.
How to explain the ups and downs
Most client anxiety comes from week-to-week swings. Here's the wording I use:
"AI tools don't give the same answer twice. Even the same question asked four times in one day gave us different results. So we don't judge you on any single answer. We ask the same questions every day, count how often you're named, and show the range. If the range of this month and last month overlap, nothing really changed. If they don't, something did, and we'll tell you why."
It also helps to explain why answers change: models generate each answer fresh, and they may read different sources each time. Thinking Machines Lab has a readable explanation of why identical prompts give different outputs.
What to leave out of an AI visibility report
Some things look impressive and mislead clients.
- Single screenshots as proof. Use them as illustrations at most, labelled with the date.
- "AI search volume." Nobody publishes how often people ask ChatGPT a question, so any such figure is an estimate.
- A "rank #1 in ChatGPT" claim. There's no fixed rank. See why there's no rank #1 in ChatGPT.
- A blended score with no range or sample size. It hides which AI system moved, and by how much.
- Comparisons across changed question sets. Different questions, different numbers.
- Missing AI Overviews counted as zeros, or failed checks counted as "not named".
- Search Console as AI proof. Google counts AI Overview and AI Mode traffic inside the normal "Web" results, as its page on AI features and your website explains, so it can't show AI visibility on its own.
The template in one table
Copy this structure into your own report.
| Section | What to include | Example line from Kato's report |
|---|---|---|
| Headline | Named rate, answers counted, range, change | 16.6% of 942 answers (±2.4), last period 16.3%. No real change |
| By AI system | Same rate per system, missing AI Overviews noted | AI Mode 22.9%, Perplexity 21.4%, ChatGPT 14.1%, Gemini 13.0%, AI Overviews 10.9% |
| Change | Same questions only, in points, vs the range | +0.3 points, within range. Cited rate 12.7% → 8.9% |
| Questions | Leading, slipping, invisible | Burnaby 62%, EV charger 27% → 19%, six questions at 0% |
| Competitors | Most-named businesses | Intel Power (87+), Expert Electric (74), TDR (74+) |
| What AI read | Cited vs named, pages read without the name | Site cited in 8.9% of answers, mostly by Perplexity |
| Google vs AI | Google position next to AI rate | Top 10 on 4 of 16 questions; AI's best question not on Google |
| Actions | 3–5, each tied to a number | Coquitlam pages and listings: check the Coquitlam rate |
| Method | 2–3 lines | Daily, five AI systems, logged out, same 16 questions, 95% ranges |
How often to report
Monthly, with a quick weekly look.
- Monthly report: enough answers for useful ranges, and enough time for changes to show.
- Weekly glance: for big drops only. Look for a whole AI system going quiet or a question falling to zero.
- Quarterly: review the question set with the client, and restart comparisons from the change date.
Delivering it. If you report to several clients, a branded PDF saves hours.
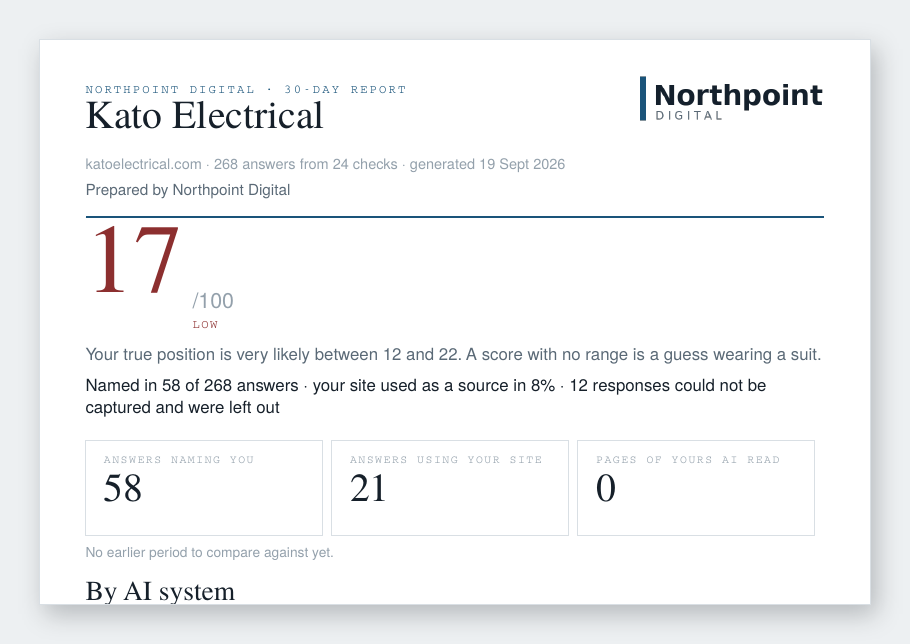
LLM Visibility Lens builds the monthly report automatically from daily checks. It includes the rate with its range, each AI system, questions won and lost, competitors, the sites AI read, Google positions and an action plan. On the agency plan it carries your logo and name per client. See the agency plan and pricing. If you're comparing tools, there's a plain comparison with Semrush's AI visibility tool.
More reading:
- What one free check can and can't do
- How to rank in ChatGPT
- How to rank in AI Overviews
- Google AI Mode for local businesses
- Perplexity vs ChatGPT
- ChatGPT citations
- Spoken questions
- Google Business Profile and AI answers
- 5 AI systems, 35 questions
- We asked AI who to hire 80 times
There's also the changelog, the FAQ page, the security page and the free question finder. If you'd like me to review a client report you've built, get in touch.
Questions people ask
What should an AI visibility report include?
A named rate with the number of answers and a range, the same rate for each AI system, change since last period on the same questions, questions won and lost, the competitors AI named instead, how often AI cited the client's site, Google positions next to AI results, three to five actions tied to numbers, and a short method note.
How do I explain AI visibility changes to a client?
Explain that AI tools give different answers to the same question from day to day, so you measure how often they're named over many answers and show a range. If this period's range overlaps last period's, nothing really changed. Only call a change real when the ranges don't overlap.
How often should I report AI visibility to clients?
Monthly works best: it gives enough answers for useful ranges and enough time for changes to show. Add a quick weekly check for large drops, and review the question set with the client every quarter.
Can I use one ChatGPT screenshot as proof in a client report?
Not as proof. The same question can get a different answer an hour later. Use screenshots only as dated illustrations, and base the report on how often the client was named across many answers.
What is a good AI visibility score?
It depends on the business and its questions, so compare a client with their own past periods and their competitors, not with a universal benchmark. In our example, a Vancouver electrician was named in about 16% of answers overall but in over 50% for his strongest Vancouver and Burnaby questions.
Can I white-label AI visibility reports for clients?
Yes. Some AI visibility trackers produce branded PDF reports under the agency's logo and name. Whichever tool you use, check the report shows the number of answers and a range for each figure, not just a score.

Harjeet Singh Bedi Founder, LLM Visibility Lens · SEO consultant, Bedi SEO
Harjeet has worked in SEO since 2010, first in agencies and now running Bedi SEO for local businesses, online stores and agencies. He built LLM Visibility Lens after clients kept asking whether they showed up in ChatGPT and other AI tools and nobody could give them an honest, measured answer. Every figure in this article comes from answers his tool collected.